


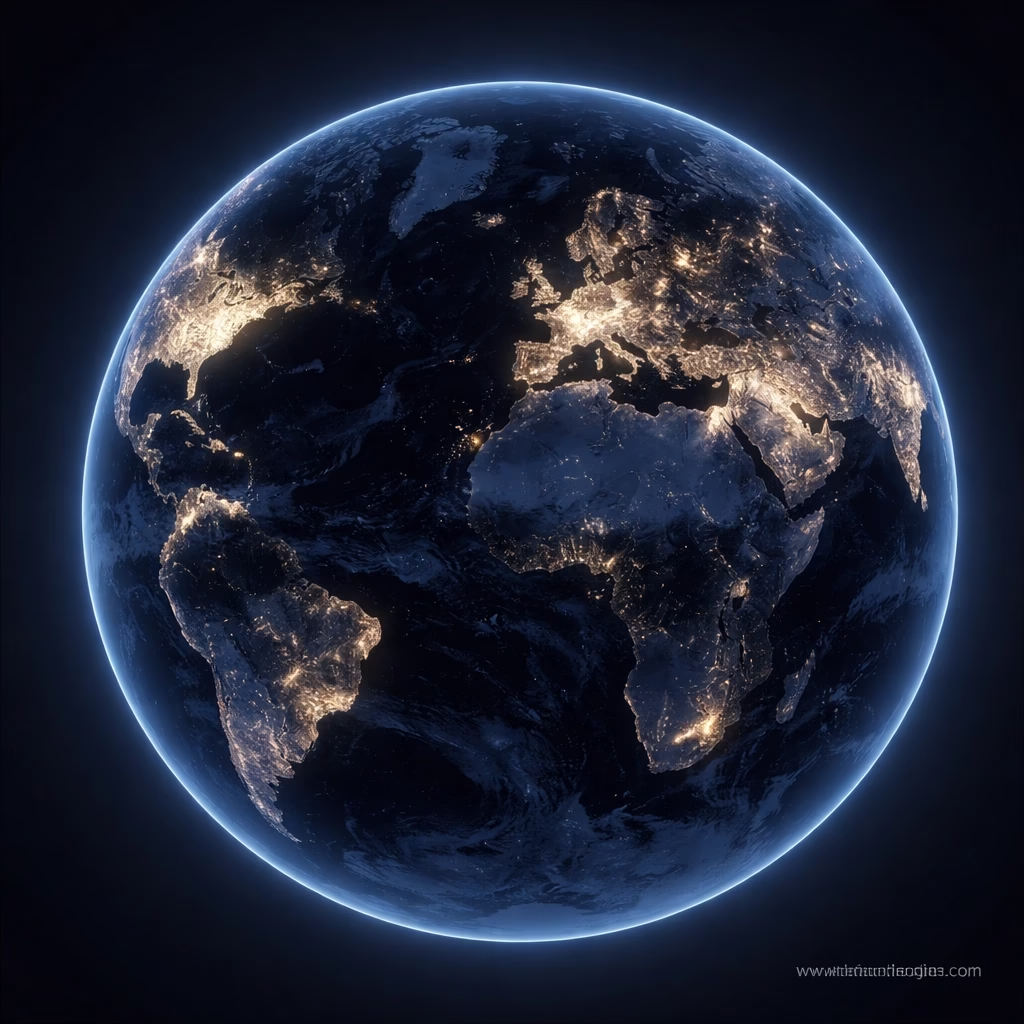
NASA has recently unveiled its most detailed global maps of Earth at night, offering an unprecedented view of our planet's illuminated and unlit regions. These updated composite images, leveraging data primarily from the Suomi NPP satellite's Visible Infrared Imaging Radiometer Suite (VIIRS), capture the intricate patterns of human activity and natural phenomena across every continent, showcasing changes up to late 2023. The visualizations provide critical insights into urbanization, energy consumption, and environmental light pollution.
Background: Decades of Nocturnal Observation
The endeavor to map Earth's nocturnal luminescence stretches back decades, providing a unique lens through which to observe human civilization. Early efforts, notably by the Defense Meteorological Satellite Program (DMSP) operational linescan system, began in the 1970s, yielding coarse but foundational global night light maps from the 1990s through the early 2010s. These initial datasets offered the first consistent, long-term global record of artificial lighting.
A significant leap in capability arrived with the launch of the Suomi National Polar-orbiting Partnership (Suomi NPP) satellite in October 2011. This sophisticated platform carries the Visible Infrared Imaging Radiometer Suite (VIIRS), an instrument equipped with a "day-night band" sensitive enough to detect faint light sources down to the glow of a single ship at sea or an aurora borealis. VIIRS began collecting usable night light data in April 2012, revolutionizing the resolution and accuracy of these global observations.
NASA's Earth Observatory, in collaboration with scientists from the Goddard Space Flight Center, has been instrumental in processing and releasing these annual composite maps. These visualizations serve as more than just pretty pictures; they are vital scientific tools. Researchers utilize them to track economic development, monitor population shifts, assess disaster impacts, and study the ecological effects of light pollution on both human and wildlife populations across the globe.
Key Developments: Unveiling Recent Transformations
The latest iteration of NASA's night light maps, compiled from VIIRS data through late 2023, represents a significant refinement in data processing and visualization. Scientists have enhanced algorithms to filter out transient light sources like moonlight, atmospheric scattering, and cloud cover more effectively, resulting in clearer, more consistent annual composites. This meticulous approach allows for unprecedented detail in observing subtle, year-over-year changes in Earth's nighttime luminosity.

One of the most striking developments captured is the relentless march of urbanization. Megacities such as Mumbai, India, and Lagos, Nigeria, show pronounced outward expansion of their illuminated footprints, indicative of rapid population growth and infrastructure development. Similar patterns are evident across burgeoning urban centers in China, Southeast Asia, and parts of South America, where once dark peripheries now glow with new residential and commercial districts.
Conversely, the maps starkly illustrate the devastating impact of geopolitical conflicts. Regions affected by prolonged unrest, notably parts of Syria and Ukraine, exhibit a noticeable dimming of artificial lights in their war-torn zones. This reduction in radiance correlates directly with population displacement, infrastructure destruction, and disruptions to power grids, offering a poignant visual record of human suffering.
Beyond human settlements, the maps also reveal dynamic natural and industrial activities. Persistent bright spots off the coasts of Argentina and Japan, for instance, are attributed to massive fishing fleets utilizing powerful lights to attract squid and other marine life. Similarly, the dramatic flaring of natural gas, particularly prominent in oil-producing regions like the Bakken Formation in North Dakota or parts of the Middle East, stands out as intense, localized points of light. The increasing adoption of energy-efficient LED lighting across many developed nations presents a complex challenge for analysis, as these lights can emit less overall radiance while still providing illumination, requiring careful interpretation of changes in brightness.

Impact: Far-Reaching Consequences for Planet and People
The insights gleaned from these nocturnal maps extend far beyond academic curiosity, influencing a broad spectrum of scientific, policy, and environmental domains. For urban planners and economists, the expanding illuminated areas serve as crucial indicators of economic growth, population migration, and infrastructure development. Governments and international organizations use these data to assess progress on electrification initiatives, particularly in developing regions, and to gauge the efficacy of disaster relief efforts by monitoring power restoration.
Ecologists and conservationists are particularly concerned with the escalating issue of light pollution, vividly depicted by the maps' ever-brightening regions. Artificial night light is increasingly recognized as a significant environmental stressor, disrupting natural light cycles essential for countless species. Migratory birds, disoriented by city lights, often collide with buildings. Nocturnal insects, vital for pollination, are drawn away from natural habitats. Sea turtle hatchlings, mistaking artificial lights for the moon's reflection, crawl inland instead of towards the ocean, drastically reducing their survival rates.
Furthermore, light pollution has documented impacts on human health, affecting sleep patterns and circadian rhythms. Researchers are using these detailed maps to identify areas where light pollution is most severe, informing policy decisions aimed at mitigating its adverse effects through smart lighting design, shielded fixtures, and the establishment of "dark sky" preserves. These efforts seek to balance the benefits of illumination with the imperative to protect natural darkness.
What Next: The Future of Night Light Mapping
The evolution of Earth's night light mapping is set to continue with even greater precision and analytical depth. The Joint Polar Satellite System (JPSS) program, which includes the NOAA-20 satellite (launched in 2017) and the recently launched JPSS-2 (now NOAA-21, launched in 2022), carries advanced VIIRS instruments, ensuring continuity of this vital dataset for decades to come. These missions will provide consistent, high-resolution observations, allowing scientists to track changes with unparalleled accuracy.
Future advancements are expected to move beyond simple brightness measurements. Researchers are exploring methods to extract more spectral information, which could differentiate between various light sources (e.g., LED, sodium vapor, incandescent) based on their specific light signatures. This would offer a more nuanced understanding of energy consumption patterns and the types of light pollution being emitted. Efforts are also underway to produce more frequent, potentially even hourly, night light maps, offering dynamic insights into daily human activity cycles.

The integration of artificial intelligence and machine learning algorithms promises to unlock new analytical capabilities. These technologies could automatically identify specific light patterns associated with different human activities, detect anomalous changes indicative of disasters, or even forecast future urban growth based on historical trends. International collaborations are also gaining momentum, aiming to standardize night light data collection and analysis, fostering a global understanding of light pollution and informing coordinated mitigation strategies. The ultimate goal remains to provide ever-clearer insights into humanity's footprint on Earth, seen through the revealing lens of its nocturnal glow.


